2023 Season
Oh, Heavy! You Hurt ‘Em
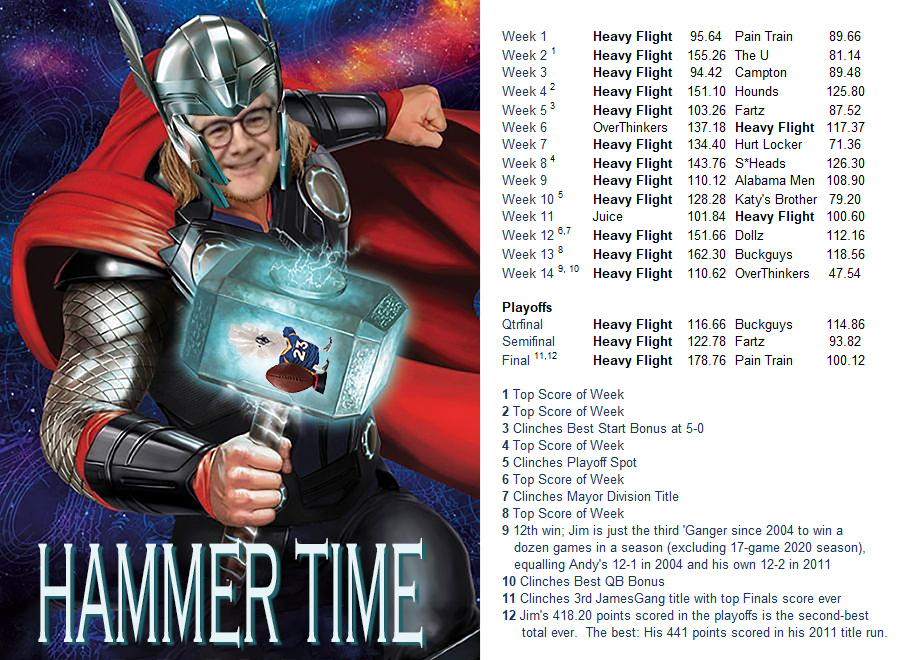
I believe they call that a “no doubter.” Heavy Flight sealed the deal this past weekend, scoring a record number of points in a JamesGang Final to finish a dominant, wire-to-wire championship season. If Flight was the Hammer, does that make the rest of us the nail? Ouch.
In its 178.76 – 100.12 win over Pain Train, the Heavies got a season-best (and IRL franchise-setting) performance from CeeDee Lamb, and season’s second-best outputs from Kyren Williams and Travis Etienne. Everyone was in double-digits, as you’d expect (but not always get) from a lineup loaded with three players ranked at the top of their position (Josh Allen, Lamb, and the Ravens D/ST); one ranked second (Etienne); two ranked fifth (Williams and Puka Nacua); one ranked sixth (K Jason Myers), and one ranked eighth (TE Trey McBride).
We examined last week how Jim and Max’s teams came together this year, and let us remember that Pain Train was no slouch, either. He’d won ten in a row coming into the Final, averaging 124 points per game (and hitting 161 once and around 140 three separate times). That ten in a row, including a 6-0 mark in the Apollo Division and two wins in the Playoffs, nearly tied a JamesGang record, too: Only Andy, in his Hungry Possum years, has done better with 11 in a row in 2004.
(From the Dept. of Splitting Hairs: Andy’s 11 in a row in 2004 were all regular season wins, as were the nine in a row by Andy (2017), Jeff (2010) and Thurm (2021). Max’s eight straight wins this regular season ties Jim (2013) and Jose (2006) for third-best regular season winning streak mark.)
Flight’s Final score of 178.76 is the most points we’ve seen in a Championship game, eclipsing Thurm’s 2019 Final performance by about eight points (171). It’s not actually the most points ever scored in our playoffs, although it comes close. In 2011, Juice scored 180 in the fifth-place game. (Interestingly, Thurm has gone for 170+ in three separate Playoff games: 170 in the 2010 Quarterfinals; 171 in that 2019 Final, and 173 in the 2009 Quarterfinals. Also, Dollz did 155 in the 2021 7th Place Game and 158 in the 2013 Consolation Round 2. So Thurm owns five of the top 15 playoff scores ever. Note to self: Avoid Dollz in the playoffs.)
Flight fielded the most potent offense all year, so it’s little surprise that he went big in the playoffs, too. Flight scored 418.2 points in three playoff rounds, a total bested only by the 441 he scored in his 2011 championship year (as the Floorburners). Dollz recorded 410 in his 2009 title season, and 409 in his 2019 title season. I’m sensing a pattern here. Rounding out the top ten playoff performances: Andy 397 in 2010 (2nd place); Andy 394 in 2007 (Champ); Juice 394 in 2011 (5th place); Jeff 393 in 2015 (5th place); Hurt 385 in 2019 (2nd place), and Thurm 378 in 2010 (4th place).
Twelve regular season wins is another standard set — or, in this case, shared — by Flight this year. Andy went 12-1 in 2004 and now Jim has gone 12-2 in 2011 and in 2023. Those dozen wins brings Jim’s career victories to 152 since 2004, and he trails only Juice at 155 for most career wins. His winning percentage of .569 also trails only that of Juice, at .581, across that span — although let us not slight Haydn’s .593 mark (35-24) accomplished across four seasons.
In the end, all those points and all those wins led Heavy Flight to the 2023 James Gang Championship. It’s Jim’s third James Gang ring, following his first in 2011 as the Floorburners and his second in 2014 as Heavy Flight, and it now sets him apart from our two-ring bearers: Greg, Kurt, Max and Thurm. But it leaves him, and the rest of us, still looking up at Juice and his four rings since 2004.
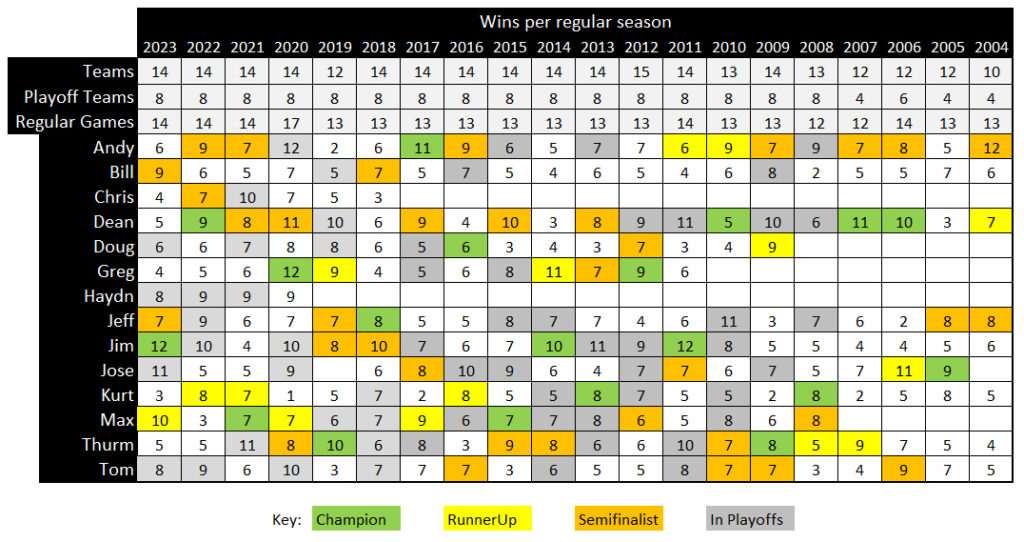
For your reading pleasure, here’s the league history since 2004 with category leaders highlighted in green. And below that, the season record by year.

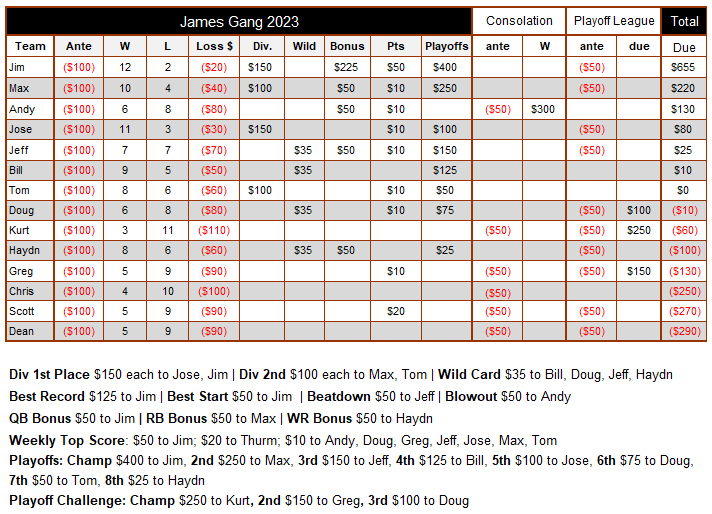
And finally, the 2023 Winning$ grid. (REVISED WITH PLAYOFF CHALLENGE RESULTS)
As I’m sure one of us has said more than once, U win some and U lose some. See below for where you ended up this year.
Dr. Jim Explains It All

Sure, the playoff bracket will be set for real in just two weeks’ time, and then the title game crowns a champion after just three more, but who wants to wait? Wouldn’t you rather know right now who the best teams really are? Dr. Jim is here to help.
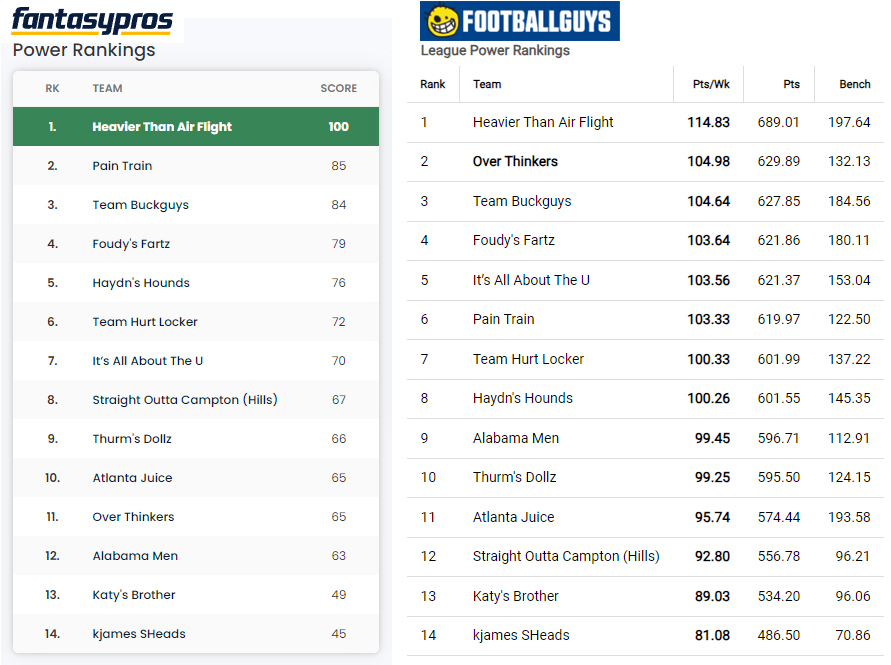
ESPN and other members of the Fantasy Football Industrial Complex (FFIC) have been charting our league’s Power Rankings all season, but now the FFG is here with the definitive take. I don’t pretend to understand his methodology, but his conclusions are revelatory. But before we dive in, let’s set the scene with the FFIC’s views.
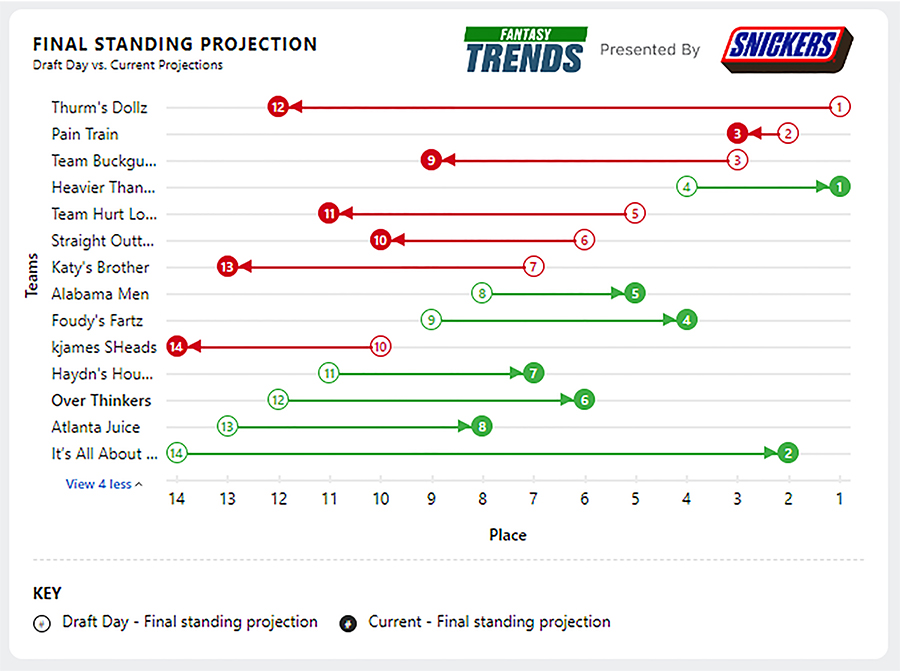
Heavy Flight tops the charts in the ESPN, Fantasy Pros, and FootballGuys’ rankings, as you’d expect of a team that’s won ten of 12 games and put up more points than anyone else. There’s some consensus on the Top Five, too: Fartz also appears in all three lists (at no. 4); The U and Pain Train and Buckguys all appear twice. In with a single mention are Alabama Men, Hounds and OverThinkers.
Let’s turn now to Jim’s rankings. This first graph charts your Actual Wins vs your Expected Wins; your expected wins, I believe, are your average wins if playing all schedules.
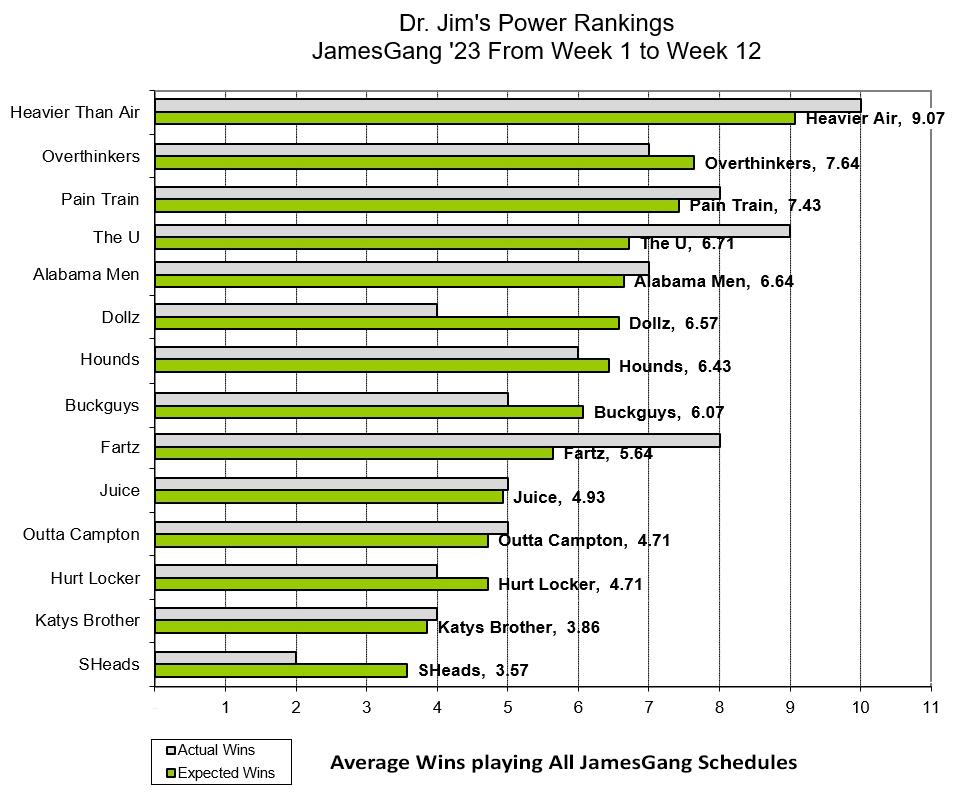
Again, a lot of the usual suspects (Flight, Thinkers, Pain, The U, Men…). Although here’s a wrinkle: Dollz have entered the chat, at no. 6! Also, Fartz drops to nine. Jim shows some of his work in the next graph, which charts how many wins we’d all have playing everyone else’s schedule.

Highlighted cells correspond to actual status. Examples: Hurt would still have five wins playing Buck’s schedule, but would only enjoy four wins with Juice’s slate. Instead of their seven wins, Bama Men would have five with OverThinker’s schedule. Katy’s Brother would have a losing record with 12 of the schedules, BUT would be an eight-game winner with Fartz’s schedule.
And speaking of those schedules: Another calculation Jim made was Strength of Schedule. He determined that Dollz have had the most difficult schedule: If we all had played Thurm’s schedule, “Twelve of the teams would have losing records — lost 7 or more at this point — with the average number of wins at just 3.9,” says Jim. Who’s had it easiest? Fartz, says Jim. Teams would average eight wins with Fartz’s schedule.
And here’s a fun one: your head-to-head record with each team each week. Some of us have, or once had, this kind of bet going: in addition to their actual James Gang opponent each week, guys would “play” each other. If Fartz and S*Heads still track this — not sure if they still indulge — it’s been a good year for Bill: In nine of 12 weeks so far, he’s outscored Kurt. Find your favorite foil below and see how well, or not, you’ve done against him.
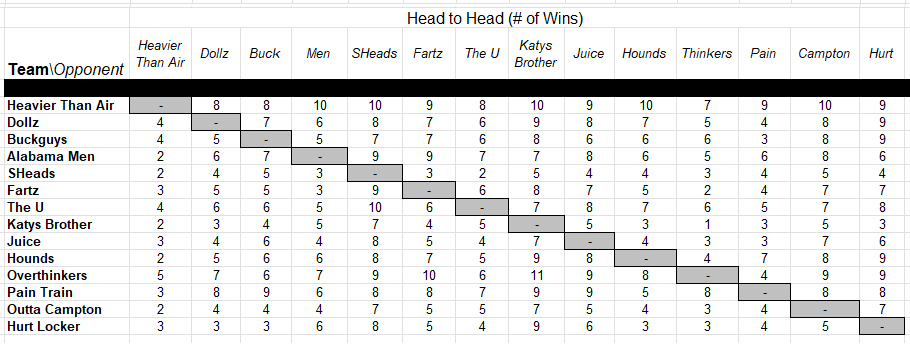
Your record against all teams is also a pretty good indicator of your success this year. Pain Train, for example, has a winning weekly record against ten other teams. Heavy Flight, no surprise, owns a winning record against all 13 of us. Of the other three playoff qualifiers, only Fartz has “lost” to more teams than he’s beaten. Alabama Men have seven winning records, The U has six.
What does this mean for the playoffs? Does Heavy Flight’s immaculate head-to-head record make him invincible? Should Pain fear only Heavy Flight (he’s not alone there) and Hounds? It probably doesn’t work that way, because shit happens, as we all well know. There’s luck: the luck of the draw, for one, as Jim has shown: Your down week just happens to come against the other guy’s average week. Also, the IRL puck luck: an in-game injury to a starter; a penalty that calls back the catch or run that would’ve put you over the top; a vultured TD; etc. Finally, there’s the “who’s hot” factor as we head into the playoffs. Dr Jim has provided a tool to determine that, too, and it’ll be on the Playoffs page shortly for those calculations. Or, if you’re Fartz, maybe just give it a miss.

With each passing week, Alabama Men rewrite the definition of a “close game.”
You like a 1.46-point loss, to The U in Week 5? Here’s a 1.22-point loss, to Heavy Flight in Week 9.
Or perhaps you’re partial (we know Tom is) to a 0.38-point win, over Campton in Week 6? Then here’s a 0.32-point win, over Hurt Locker in Week 10.
Tom’s not the only ‘Ganger to win, or lose, or both, by the scantest of margins this season. Nineteen games have been decided by less than ten points, and ten of those have been decided by less than three. Ouch, babe.
Why so close? Is it because scoring is down across the league? Some extraordinary performances (in both fantasy and IRL) to the contrary, this is actually the Year of the Under in the NFL. Indeed, according to NFL.com, 2022 and 2023 mark the lowest average scoring per game since 2007: 43.8 points in ’22 and 44.5 points through ten weeks of ’23. Scoring peaked at 50.2 per game in 2020.
Does less scoring make for closer games? Dunno. It sure makes every point precious, however.
Here’s how we’ve all fared this season across five strata of game scores. I’ve indicated each team’s won-loss record in games decided by the indicated range of points. Spoiler Alert: Most games are NOT close. Of our 70 games through Week 10, more than half — 37 — have been decided by more than 20 points.
Record by Margin of Score, Weeks 1 – 10
| Team | Under 5 | 5+ to 10 | 10+ to 15 | 15+ to 20 | Over 20 |
|---|---|---|---|---|---|
| Alabama Men | 2 – 2 | 1 – 0 | 1 – 0 | 2 – 2 | |
| Buckguys | 0 – 1 | 1 – 0 | 0 – 1 | 4 – 3 | |
| Campton | 0 – 3 | 0 – 1 | 3 – 3 | ||
| Dollz | 0 – 1 | 1 – 0 | 0 – 1 | 3 – 4 | |
| Fartz | 1 – 1 | 1 – 0 | 1 – 0 | 0 – 1 | 4 – 1 |
| Heavy Flight | 2 – 0 | 1 – 0 | 2 – 1 | 4 – 0 | |
| Hounds | 1 – 0 | 0 – 1 | 1 – 0 | 2 – 0 | 1 – 4 |
| Hurt Locker | 0 – 1 | 1 – 1 | 2 – 5 | ||
| Juice | 1 – 1 | 1 – 0 | 1 – 1 | 0 – 5 | |
| Katy’s Brother | 2 – 3 | 0 – 1 | 1 – 3 | ||
| OverThinkers | 2 – 0 | 1 – 0 | 0 – 2 | 1 – 0 | 3 – 1 |
| Pain Train | 0 – 1 | 0 – 2 | 0 – 1 | 6 – 0 | |
| S*Heads | 1 – 1 | 1 – 2 | 0 – 1 | 0 – 4 | |
| The U | 1 – 0 | 1 – 0 | 0 – 1 | 1 – 0 | 4 – 2 |
Now let’s make it really hurt. (Sorry, Greg.) Here are the Top Ten Closest Games.
| Rank | Margin | Winner | Loser |
|---|---|---|---|
| 1 | 0.32 | Bama Men | Hurt Locker |
| 2 | 0.38 | Bama Men | Campton |
| 3 | 1.00 | Juice | Campton |
| 4 | 1.10 | Fartz | Buckguys |
| 5 | 1.16 | Hounds | S*Heads |
| 6 | 1.22 | Heavy Flight | Bama Men |
| 7 | 1.28 | OverThinkers | Juice |
| 8 | 1.46 | The U | Bama Men |
| 9 | 1.50 | S*Heads | Pain Train |
| 10 | 2.62 | OverThinkers | Fartz |
And here’s how many games we’ve won, and how many games we’ve lost, by less than 10 points.
Games Won and Games Lost by Less Than 10 Points
| Alabama Men | 3 | Campton | 4 | ||
| Heavy Flight | 3 | Pain Train | 3 | ||
| OverThinkers | 3 | S*Heads | 3 | ||
| Fartz | 2 | Alabama Men | 2 | ||
| Juice | 2 | Hurt Locker | 2 | ||
| S*Heads | 2 | Buckguys | 1 | ||
| The U | 2 | Dollz | 1 | ||
| Hounds | 1 | Fartz | 1 | ||
| Hurt Locker | 1 | Juice | 1 | ||
| Buckguys | 0 | Hounds | 1 | ||
| Campton | 0 | Heavy Flight | 0 | ||
| Dollz | 0 | Katy’s Brother | 0 | ||
| Katy’s Brother | 0 | OverThinkers | 0 | ||
| Pain Train | 0 | The U | 0 | ||
Sorry, Madame Mayor.
But the Apollo Division just might be better than your guys
The first half of the season is in the books and with it, six weeks of division-on-other-division action. Each of us has at least one interdivision game remaining, and some have two, but there are still several observations we can make based on the first six weeks. It might — might! — even lead you to draw a conclusion or two. Ready, Madame Mayor?
- Apollo teams won 25 of 42 matchups, a winning clip of .595
- Mayor teams won 17 of 42 matchups, a winning clip of .405
- Apollo teams scored 4,514 points the first six weeks, Mayor teams 4,155
- Apollo teams outscored Mayor teams by a combined 359 points
- Apollo teams hit the century mark 25 times, Mayor teams 18 times
- Mayor teams recorded four games of 150+ points, Apollo three (an upset!)
- Apollo teams have won the weekly top score bonus three times, Mayor thrice as well
- Apollo teams recorded five of the top ten scores, Mayor the other five
- Apollo teams recorded 13 of the top 20 scores, Mayor seven
- Mayor teams recorded eight of the lowest ten scores, Apollo two
- Mayor teams recorded 15 of the lowest 20 scores, Apollo five
Where are all those points coming from, and who’s reaping the benefits? Here are scoring leaders through seven weeks:
Top Overall Scorers
| Rank | Player | Team | Division |
|---|---|---|---|
| 1 | Tyreek Hill | Bama Men | Mayor |
| 2 | Christian McCaffrey | The U | Apollo |
| 3 | Stefon Diggs | Hounds | Apollo |
| 4 | Josh Allen | Heavy Flight | Mayor |
| 5 | Jalen Hurts | Hurt Locker | Mayor |
| 6 | Pat Mahomes | S*Heads | Mayor |
| 7 | AJ Brown | Fartz | Apollo |
| 8 | Raheem Mostert | Thinkers | Apollo |
| 9 | Lamar Jackson | Campton | Apollo |
| 10 | Puka Nacua | Heavy Flight | Mayor |
Top QB Scorers
| Rank | QB | Team | Division |
|---|---|---|---|
| 1 | Josh Allen | Heavy Flight | Mayor |
| 2 | Jalen Hurts | Hurt Locker | Mayor |
| 3 | Pat Mahomes | S*Heads | Mayor |
| 4 | Lamar Jackson | Campton | Apollo |
| 5 | Tua Tagovailoa | Fartz | Apollo |
| 6 | Kirk Cousins | Pain Train | Apollo |
| 7 | Jared Goff | Juice (from Pain) | Mayor |
| 8 | Justin Herbert | Thinkers | Apollo |
| 9 | Russell Wilson (!) | S*Heads | Mayor |
| 10 | Brock Purdy | Hounds | Apollo |
Top RB Scorers
| Rank | RB | Team | Division |
|---|---|---|---|
| 1 | Christian McCaffrey | The U | Apollo |
| 2 | Raheem Mostert | Thinkers | Apollo |
| 3 | Travis Etienne Jr | Dollz | Mayor |
| 4 | Kyren Williams | Heavy Flight | Mayor |
| 5 | Zack Moss | Fartz | Apollo |
| 6 | De’Von Achane | Thinkers | Apollo |
| 7 | D’Andre Swift | Heavy Flight | Mayor |
| 8 | Isiah Pacheco | Fartz | Apollo |
| 9 | Kenneth Walker III | Hounds | Apollo |
| 10 | Bijan Robinson | Juice | Mayor |
Top WR Scorers
| Rank | WR | Team | Division |
|---|---|---|---|
| 1 | Tyreek Hill | Bama Men | Mayor |
| 2 | Stefon Diggs | Hounds | Apollo |
| 3 | AJ Brown | Fartz | Apollo |
| 4 | Puka Nacua | Heavy Flight | Mayor |
| 5 | Keenan Allen | Thinkers | Apollo |
| 6 | DJ Moore | Hurt Locker | Mayor |
| 7 | Adam Thielen | Katy’s Brother | Mayor |
| 8 | Ja’Marr Chase | Dollz | Mayor |
| 9 | Amon-Ra St Brown | Thinkers | Apollo |
| 10 | Davante Adams | Katy’s Brother | Mayor |
Bad Projections, or Bad Coaching?
(updated through Week 7) One of ESPN’s new features this season is to recap, in the Fantasy Chat box, the week’s top scoring players, top scoring team, and lowest scoring team. Helpfully, it also compares the pre-game projections to the actual scores. In doing so, it suggests several questions: Who got it wrong, ESPN or us? If we fell short, did they over-estimate or did we not get the most of our of guys? And if we exceeded their number, are we automatically Coach of the Week?
| Week | Team | Projected | Actual | + / – |
| 3 | OverThinkers | 106.3 | 183.5 | + 77.2 |
| 5 | Dollz | 109 | 172.6 | + 63.6 |
| 7 | Pain Train | 108.8 | 161.1 | + 52.3 |
| 4 | Fartz | 100.4 | 150.8 | + 50.4 |
| 2 | Heavy Flight | 112.2 | 155.3 | + 43.1 |
| 8 | Alabama Men | 103.6 | 141.4 | + 37.8 |
| 6 | Buckguys | 112.8 | 140.4 | + 27.6 |
| 1 | The U | 99.9 | 124 | + 24.1 |
| 9 | Hurt Locker | 106.6 | 128.3 | + 21.7 |
| 8 | Juice | 112.5 | 92 | – 20.5 |
| 3 | Flight | 121.8 | 94.4 | – 27.4 |
| 5 | Hounds | 120.4 | 89.1 | – 31.3 |
| 9 | Buckguys | 119.3 | 87.7 | – 32.2 |
| 2 | Dollz | 118.8 | 86.5 | – 32.3 |
| 6 | Juice | 115 | 79.9 | – 35.1 |
| 7 | Katy’s Brother | 99.7 | 62 | – 37.7 |
| 1 | Buckguys | 101.4 | 61 | – 40.4 |
| 4 | Dollz | 114.9 | 64.4 | – 50.5 |

Life’s a breeze for Heavy Flight right now
(UPDATED Oct 12) Heavy Flight is undefeated through FIVE weeks now, having prevailed over Fartz in Week 5 in a battle of undefeated division leaders. Together, Bill and Jim are 9-1, and it’s no fluke:
- Both have been big points producers: after five weeks, Jim leads the league in scoring, and Bill is fourth.
- Both have posted 150+ games; Flight, in fact, has gone for 150+ twice. (Fartz, Katy’s Brother, OverThinkers and Dollz have scored 150+ once.)
- Coming into their game, Fartz had the top-ranked defense (Cowboys), the second-ranked kicker (Brandon Aubrey), and a top-ten QB, RB and WR.
- Flight, remarkably, had top-ten guys up and down his lineup, and the only outlier in his starting eight was CeeDee Lamb at #18. Their Week 5 game was uncharacteristically low scoring, and so some of Fartz’s rankings took a hit. Flight, not so much.
So yes, life is good for both. (You might even say they have no worries.) But only one of them has Puka Nacua, the guy who set the NFL rookie single-game receptions record with 15 in Week 2, and whose 25 receptions through two weeks also set the league record for catches by a rookie through his first two career games. His 39 receptions for 501 yards through four weeks are also both records through a player’s first four career games.
That’s all great, but get this: Puka was a week 2 waiver add by Flight, and through four games his ROI was the best for position players in our league so far. (Pretty cool, yes? Finance guys, you feel me, right?) The Hounds’ Jake Ferguson now wears that crown through five weeks, but just barely. Also, and not for nothin’: Puka is averaging 23.42 points in four Flight games. (And Jim’s other big pickup, Kyren Williams, is averaging 14.65 in those same four games.)
The table just below shows the amount of FAAB spent on each player’s PLAYED points; the average points he’s scoring per game; the points played per $1 spent, and the team’s record in the games these guys appeared in. Please Note: Points played per $0 spent — free adds, if you will — are included in table two below.
| Team | FAAB | Player | Points | PPG | Pts/$1 | Record | |
| Hounds | $1 | Chiefs D/ST | 32 | 10.67 | 32.00 | 1 – 2 | |
| Juice | $1 | Falcons D/ST | 14 | 14.00 | 14.00 | 1 – 0 | |
| Thinkers | $1 | Jason Sanders K | 8 | 8.00 | 8.00 | 0 – 1 | |
| Pain Train | $4 | Dolphins D/ST | 18 | 9.00 | 4.50 | 1 – 1 | |
| Hounds | $5 | Jake Ferguson TE | 20.5 | 5.12 | 4.1 | 2 – 2 | |
| Flight | $23 | Puka Nacua WR | 93.7 | 23.42 | 4.07 | 4 – 0 | |
| Flight | $17 | Kyren Williams RB | 58.6 | 14.65 | 3.45 | 4 – 0 | |
| Juice | $4 | Lions D/ST | 9 | 9.00 | 2.25 | 0 – 1 | |
| Hurt Locker | $2 | Nick Folk K | 4 | 2.00 | 2.00 | 0 – 1 | |
| Hurt | $6 | Joshua Kelley RB | 6.6 | 3.3 | 1.10 | 0 – 2 | |
| Thinker | $5 | Jordan Love QB | 4.98 | 4.98 | 0.99 | 0 – 1 | |
| Hurt | $17 | Hunter Henry TE | 12.8 | 6.4 | 0.75 | 0 – 2 | |
| The U | $3 | Matt Prater K | 1 | 1.0 | 0.33 | 1 – 0 | |
| Katy’s Brother | $100 | Jerome Ford RB | 28.6 | 14.3 | 0.29 | 1 – 1 | |
| Fartz | $40 | Joshua Palmer WR | 10.70 | 10.7 | 0.27 | 1 – 0 |
This second table shows the top ten returns on guys added at no cost. Again, these are PLAYED points.
| Team | FAAB | Player | Points | PPG | Record |
| Fartz | $0 | Brandon Aubrey K | 47 | 11.75 | 3 – 1 |
| Pain Train | $0 | Jake Moody, K | 37 | 9.25 | 2 – 2 |
| Juice | $0 | Riley Patterson K | 31 | 7.75 | 0 – 4 |
| Hounds | $0 | Tampa Bay D/ST | 26 | 26.00 | 1 – 0 |
| Katy’s Brother | $0 | Bryce Young GB | 25.44 | 12.72 | 2 – 0 |
| Hounds | $0 | Jacksonville D/ST | 18 | 18.00 | 1 – 0 |
| S*Heads | $0 | Kyle Pitts TE | 15.70 | 15.70 | 1 – 0 |
| Campton | $0 | Matt Breida RB | 14.2 | 7.1 | 0 – 2 |
| Buckguys | $0 | CJ Stroud | 14.16 | 14.16 | 1 – 0 |
| OverThinkers | $0 | Kyle Pitts TE | 12.8 | 6.4 | 2 – 0 |
| Flight | $0 | Brandon McManus K | 12 | 4.0 | 3 – 0 |
| Hurt Locker | $0 | Brett Maher K | 12 | 12.0 | 0 – 1 |
Did your waiver pickup, whether free or at a price, really help you win a game or two? Or more to the point: Did you leave him on the bench in a game you would’ve won if you played him? The former is difficult to quantify, but there are several quantifiable examples of the latter. Woulda-coulda-shoulda, however, is a game for some other day.

Don’t cry, Katy!
Your Boy is going to be Okay … probably
It’s preposterous that five of the seven highest-scorers in Week 3 were all part of the same James Gang matchup. It’s absurd that the three highest are rostered on the same team. It’s crazy that the highest of those three high flyers was on the bench. But you know what’s really wack? That Katy’s Brother put up 153.86 points in that game, and lost. By a lot.
Over Thinkers used 49.46 from Keenan Allen (#2 scorer in Week 3) and 45.2 from Raheem Mostert (#3), to say nothing of 31.3 from Justin Herbert (#7), to defeat Katy by the surreal score of 183.46 – 153.86. Katy got 42.2 from Davante Adams (#4), but left Adam Thielen’s 31.5 (#6) on the bench. Just like Thinker left De’Von Achane’s 55 (#1) on the bench.
Where does this rank in James Gang points-a-paloozas? Not surprisingly, it’s the most points ever scored in a single game — but actually not by that much. It is the top winning score. But it’s not the top losing score. (Note: the total and the winning score are still tops even after adjusting for 2023 fractional grade inflation.)
Here are our Top Ten Scoring Games since 2008 (our first year of PPR):
| Rank | Year | Winner | Points | Loser | Points | Total |
| 1 | 2023 | Thinkers | 183.46 | Katy’s Brother | 153.86 | 337.32 |
| 2 | 2019 | Dollz | 168 | Juice | 158 | 326 |
| 3 | 2021 | Dollz | 155 | Katy’s Brother | 150 | 305 |
| 4 | 2020 | Flight | 156 | Bama Men | 147 | 303 |
| 5 | 2011 | Flight | 177 | Juice | 123 | 300 |
| 6 | 2019 | Andy | 148 | Bama Men | 145 | 293 |
| 7 | 2018 | Craig | 174 | Andy | 118 | 292 |
| 2010 | Thinkers | 155 | Dollz | 137 | 292 | |
| 8 | 2013 | Buckguys | 172 | Andy | 118 | 290 |
| 9 | 2019 | Dollz | 171 | Hurt Locker | 118 | 289 |
| 10 | 2016 | Andy | 152 | Buckguys | 134 | 286 |
And since you’re wondering, here are our Top Ten Winning Scores. Is there a correlation between a monster game and a monster season? Well, yes: 10 of 12 on this list made the playoffs; three were Champions; two others made the Finals, and another made the Semis.
| Rank | Year | Team | Points | Playoffs? | Finish |
| 1 | 2023 | Thinkers | 183.46 | TBD | TBD |
| 2 | 2011 | Juice | 180 | Yes | 5th Place |
| 3 | 2011 | Flight | 177 | Yes | Champion |
| 2015 | Thinkers | 177 | Yes | 5th Place | |
| 4 | 2009 | Chris F | 176 | Yes | 7th Place |
| 5 | 2008 | Chris F | 175 | No | |
| 6 | 2018 | Craig | 174 | Yes | 2nd Place |
| 2010 | Andy | 174 | Yes | 2nd Place | |
| 7 | 2009 | Dollz | 173 | Yes | Champion |
| 8 | 2013 | Buckguys | 172 | No | |
| 9 | 2019 | Dollz | 171 | Yes | Champion |
| 10 | 2020 | Andy | 170 | Yes | 5th Place |
| 2010 | Dollz | 170 | Yes | 4th Place |
And finally, although you didn’t ask and you really don’t want to know, our Top Ten Losing Scores:
| Rank | Year | Team | Points | Playoffs? | Finish |
| 1 | 2019 | Juice | 158 | Yes | 8th Place |
| 2 | 2023 | Katy’s Bro | 153.86 | TBD | TBD |
| 3 | 2021 | Katy’s Bro | 150 | Yes | 7th Place |
| 4 | 2020 | Bama Men | 147 | Yes | 7th Place |
| 5 | 2019 | Bama Men | 145 | No | |
| 6 | 2010 | Dollz | 137 | Yes | 4th Place |
| 2011 | The U | 137 | Yes | 3rd Place | |
| 2020 | Katy’s Bro | 137 | No | ||
| 7 | 2010 | The U | 136 | No | |
| 2013 | Juice | 136 | Yes | 4th Place | |
| 8 | 2022 | S*Heads | 135 | Yes | 2nd Place |
| 9 | 2016 | Buckguys | 134 | Yes | Champion |
| 2018 | Andy | 134 | No | ||
| 2011 | Andy | 134 | Yes | 2nd Place | |
| 2015 | Juice | 134 | Yes | 3rd Place | |
| 2015 | Chris F | 134 | No | ||
| 10 | 2013 | Pain Train | 133 | Yes | 5th Place |
| 2010 | Craig | 133 | No | ||
| 2021 | Buckguys | 133 | Yes | 6th Place |
Ties just make some of us Miserable
Each year, it seems, we have a tie or two — some in the regular season, some even in the playoffs — and each year we resolve those ties with our own tiebreaker: Most Running Back Points Played. Some of us are okay with it, others are increasingly not so. The latter have suggested for several seasons now that we switch to fractional scoring, a feature introduced in 2017 (or so) by ESPN.
For those of us unfamiliar: the system awards a fraction of a point per one yard passed, rushed and received. Currently, we assign a full point per 25 yards passed and 10 yards rushed and received. Example: 89 yards rushing or receiving is 8 points now but 8.9 in fractional; 224 yards passing is 8 points currently and 8.96 in fractional.
If we’d been using the fractional system in Week 1, here’s how game scoring would’ve looked:
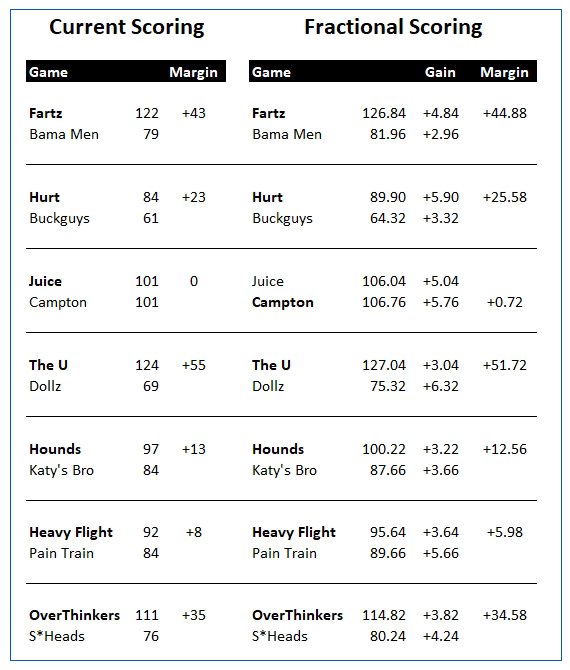
The headline? With fractional scoring, Campton would’ve beat Juice outright, rather than losing to Dean on our RB tiebreaker. So there’s that. But it’s worth noting a couple other things:
- Everyone gained points in fractional scoring, from Thurm’s +6.32 to Tom’s +2.96
- One outcome (Andy vs Juice) was reversed
- Four games were closer
- Two games were not
So should we do it? Should we change to fractional scoring as of Week 2? It’s an almost foolproof way to avoid ties, it more accurately recognizes yards gained, and — not for nothing — it would have a positive impact on our Points Bonus Standings (by, again, more accurately recognizing yards gained). What do you think?
Did your Draft make the Grade?
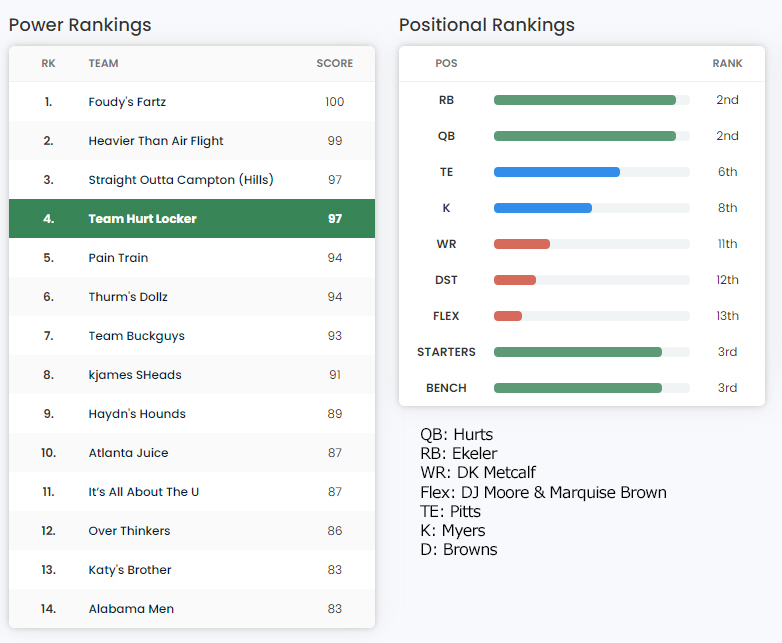
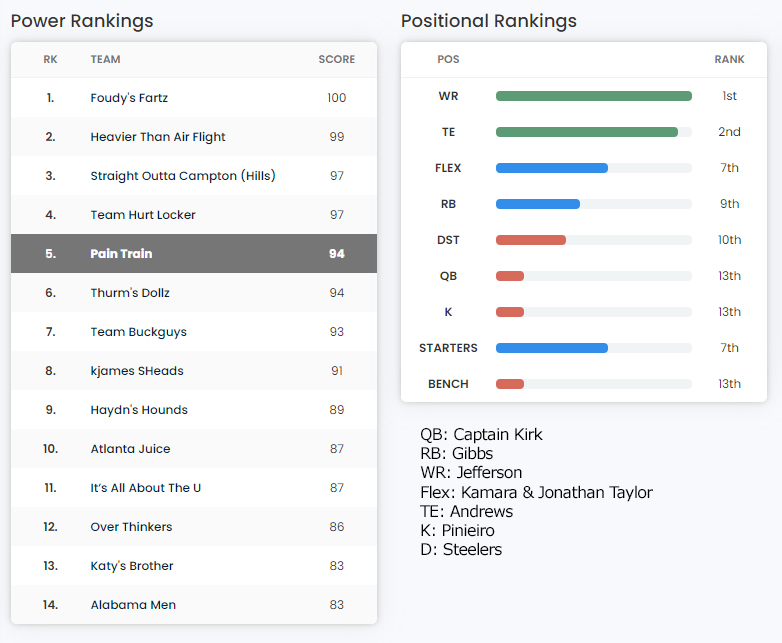
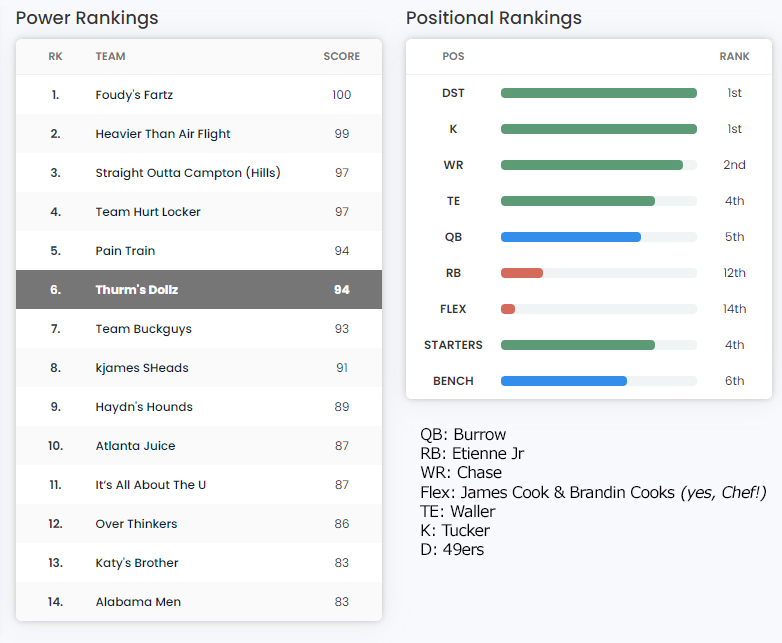
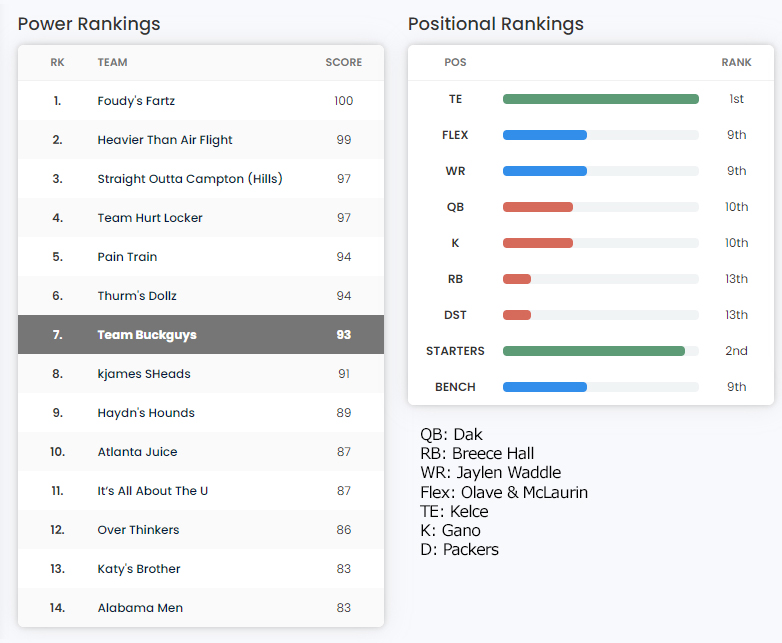
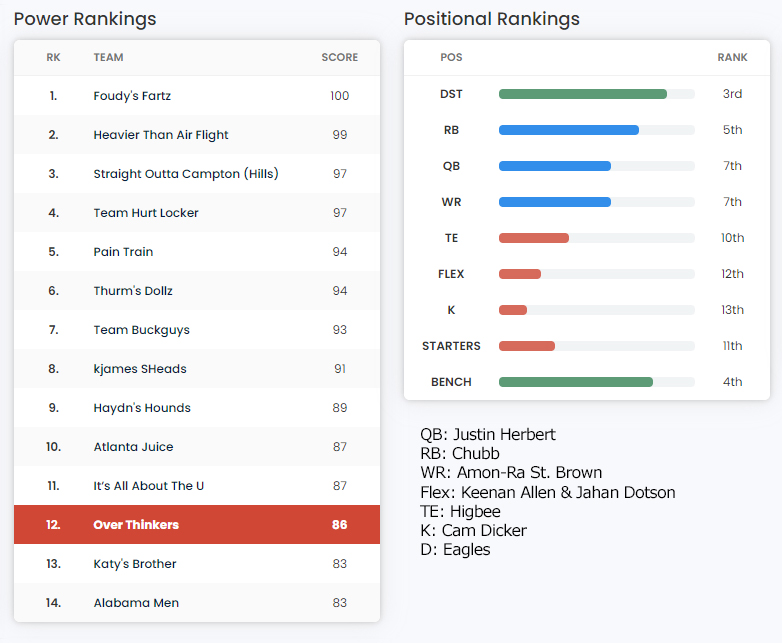
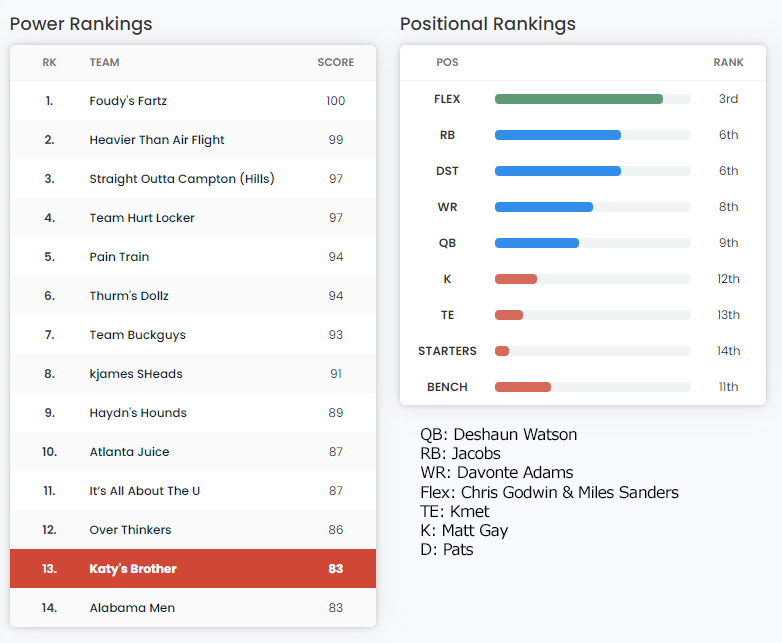
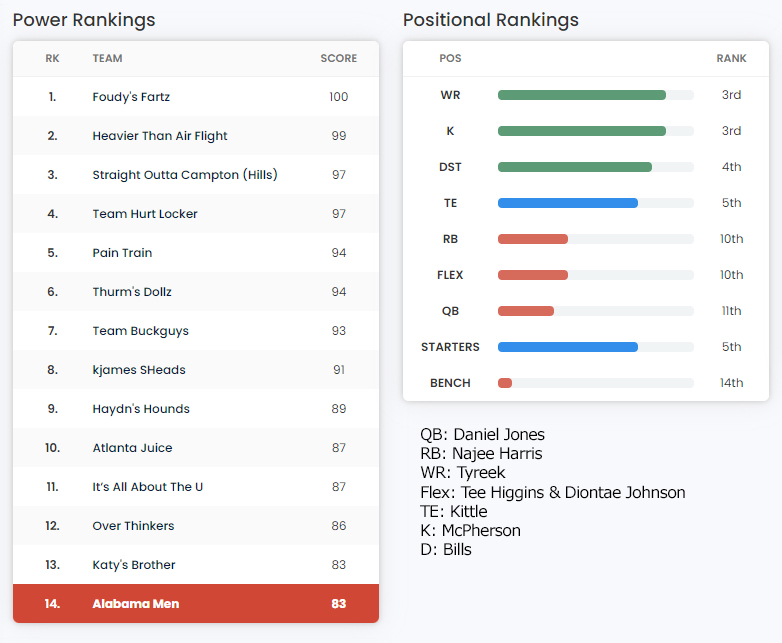
The draft is done, the dust has settled and the tears have dried, and now it’s time for the “experts” to pass judgment. Who won Draft Day? Hold on to your butts, gentlemen: It’s the FARTZ! Unless it’s the Dollz. Apparently, it depends on whom you ask…
First, let’s ask ESPN. They love the Dollz. Is it the Joe Burrow-Ja’Maar Chase stack? Perhaps it’s the presence of the projected top Defense (49ers) and top kicker (Justin Tucker)? I’d like to think it’s Thurm’s combo platter of Brandin Cooks and James Cook (yes, Chef!).
But it’s probably the projected points per game. Thurm’s current starting lineup is set to score 117 per game, says Esspin. Pain is ranked second, even though his Week 1 starters are forecast for 109 per game over the course of the year. Swap in Kamara for Jamaal Williams in five weeks, and Max rivals Thurm’s 117. The rest of their draft rankings pretty much mirror their points per game projections, with a few small hiccups (ie, their #4 Heavy Flight and #6 Campton both will put up 115 and #3 Buck will score 114). But that seems to be their reasoning.
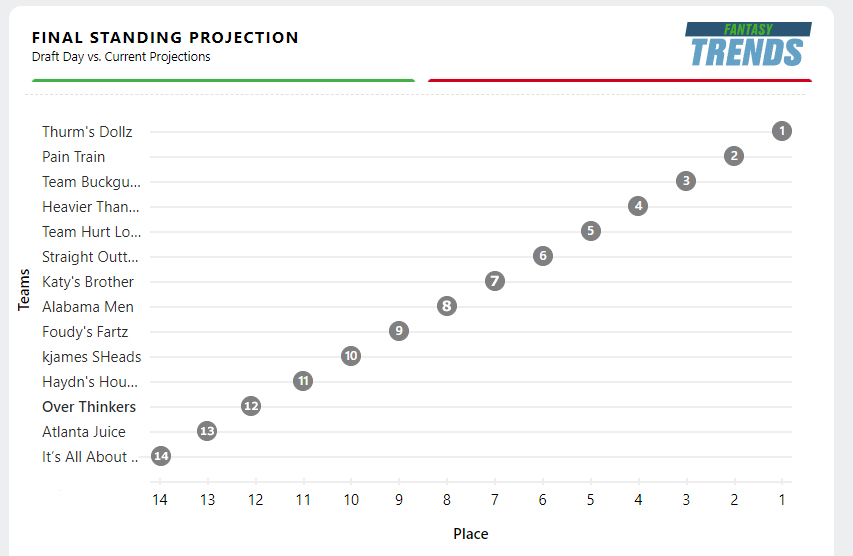
Now let’s do FantasyPros. You might’ve noticed that ESPN is using them this year for the Player Card feature, as well as Trade Analyzer. FantasyPros love The Fartz.
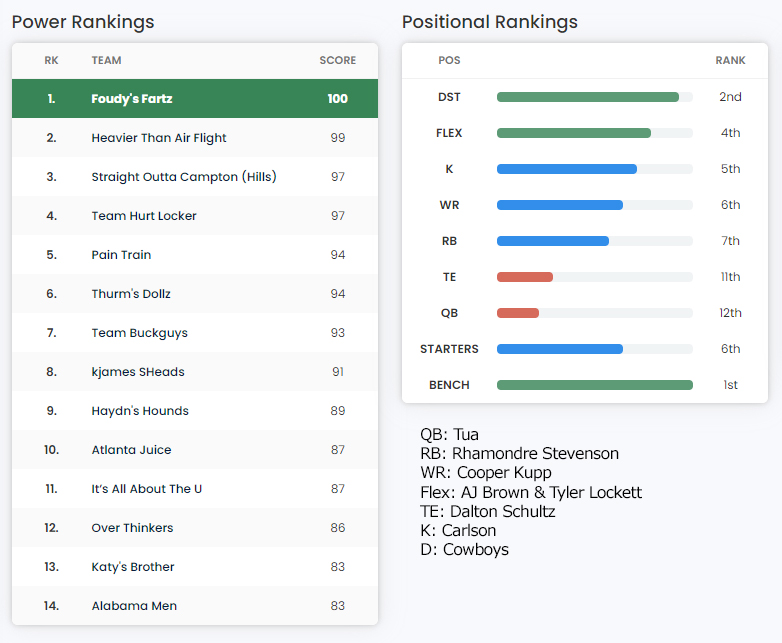
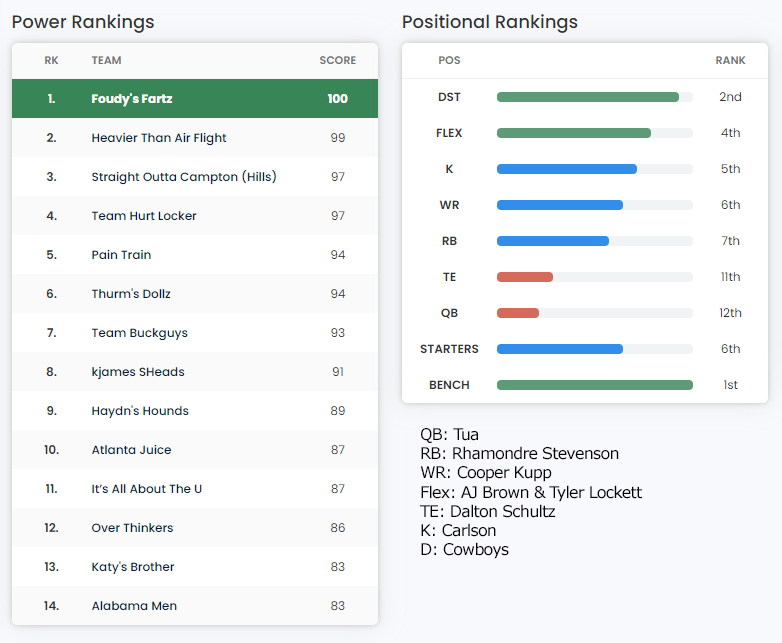
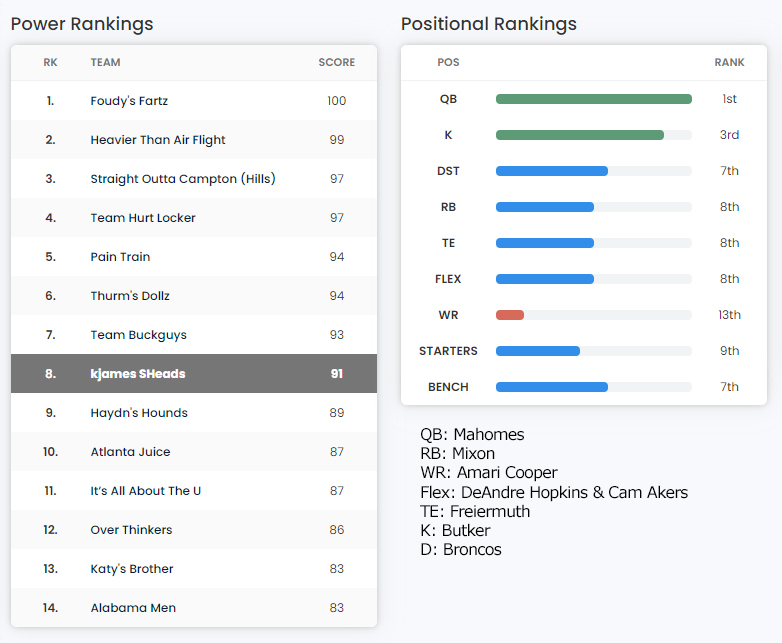
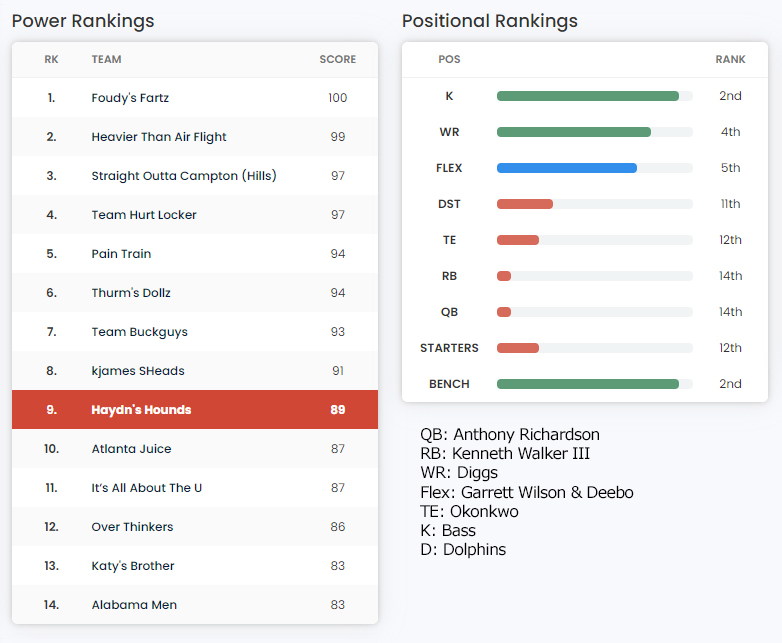
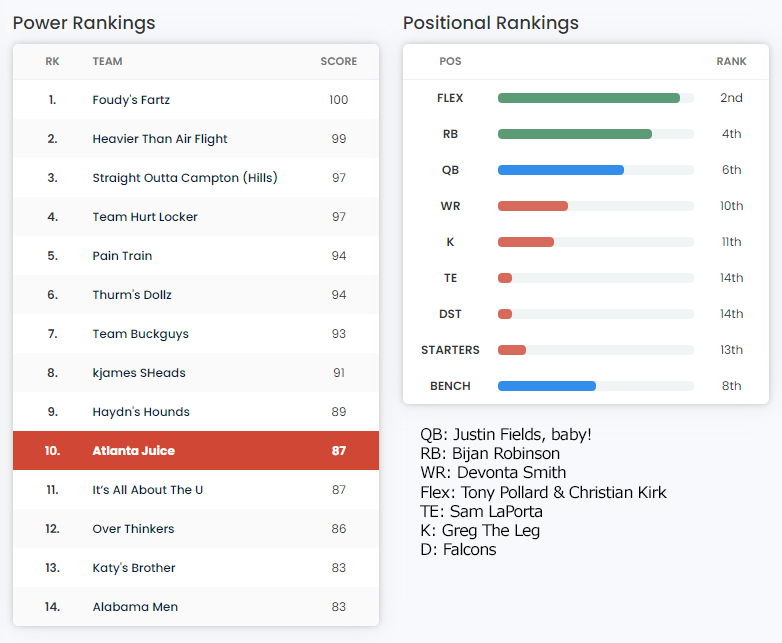
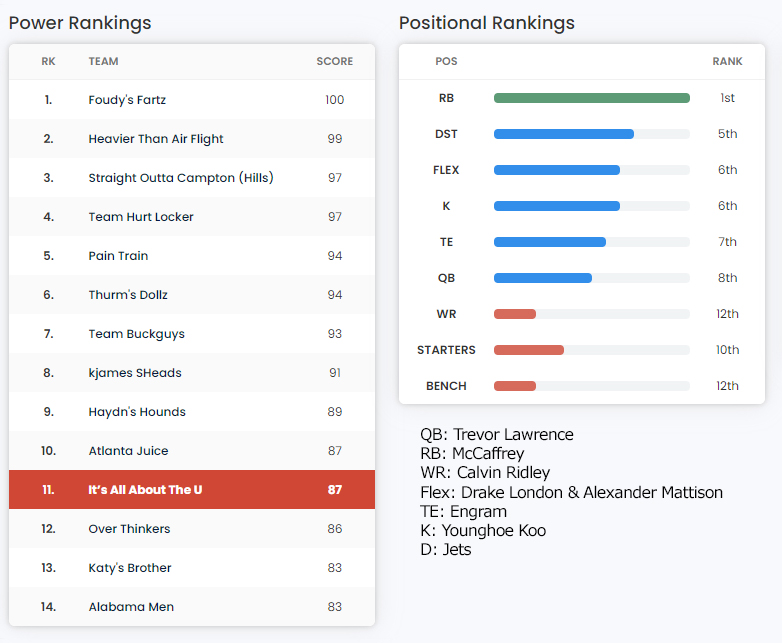
To arrive at their rankings, they optimize (in their eyes) our lineups and treat the positions a little differently than ESPN does. Starters are listed as they’ve slotted them. With that in mind, why The Fartz? Because Bill rolls deep. His bench is the best in the league, and six of eight starters are top seven. Too bad about Tua, perhaps; but that’s good news for the rest of us chasing Bill all year long.
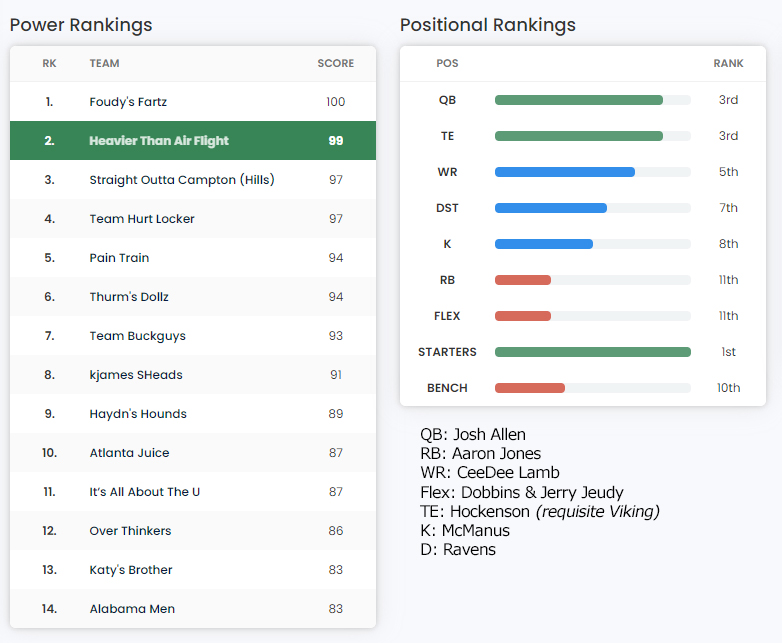
Flight at #2 boasts the best starting lineup in the league, they say, but only the 10th-best bench. I should note that since the draft, Jim has added a Chiefs WR and IR’ed Kyler Murray, elevating his bench score to 9th-best and tying Flight with Fartz at #1 in the power rankings. Poor Kyler; does everybody hate that guy that much?
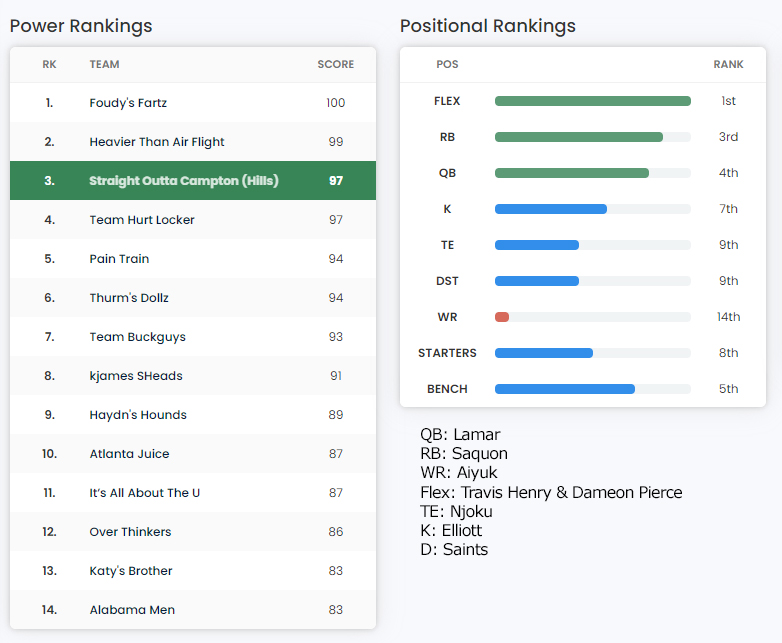
Here’s a slideshow with everyone’s FantasyPros scorecard, from first to worst.
It had to be U

He led the field through three, so is it any surprise that Max finished first after four? Well, yes. Because it was Taylor Moore who led for Max after Saturday, and then it was his Patrick Cantlay who won on Sunday.
So were there any other surprises in the 2023 FedEx Draft Open? Oh yes: Thurm leapt from #5 to #2, and Doug rose to #5 from #8. Andy, on the other hand, plunged from #6 to #11.
So start your draft prep and mark your calendars for Wednesday, Aug. 30, at 9.00pm ET. Here’s the draft order:
| Pos. | Ganger | Golfer | Score | Under | Eagle | Birdie | Bogey | 2x Bogey |
| 1 | Max | Cantlay | 265 | -15 | 20 | 6 | ||
| 2 | Thurm | Rory | 266 | -14 | 1 | 20 | 8 | |
| 3 | Jose | Fleetwood | 266 | -14 | 22 | 8 | ||
| Max | Moore | 268 | -12 | |||||
| 4 | Greg | Homa | 269 | -11 | 1 | 18 | 5 | 2 |
| Greg | Schenk | 269 | -11 | |||||
| 5 | Doug | Henley | 269 | -11 | 19 | 8 | ||
| 6 | Tom | Hovland | 270 | -10 | 1 | 22 | 10 | 2 |
| 7 | Bill | Morikawa | 270 | -10 | 1 | 15 | 7 | |
| 8 | Juice | Si Woo Kim | 271 | -9 | 15 | 4 | 1 | |
| 9 | Haydn | Kirk | 271 | -9 | 14 | 5 | ||
| Thurm | Grillo | 272 | -8 | |||||
| 10 | Kurt | Xander | 273 | -7 | 1 | 15 | 6 | 2 |
| 11 | Andy | Tom Kim | 273 | -7 | 13 | 6 | ||
| Juice | Taylor | 273 | -7 | |||||
| Haydn | Scheffler | 274 | -6 | |||||
| Kurt | Harman | 274 | -6 | |||||
| 12 | Jim | Rahm | 275 | -5 | 19 | 10 | 2 | |
| Jim | Hatton | 276 | -4 | |||||
| Bill | Bradley | 276 | -4 | |||||
| Andy | Burns | 278 | -2 | |||||
| Tom | Kitayama | 278 | -2 | |||||
| 13 | Jeff | Day | 278 | -2 | 12 | 10 | ||
| Doug | Fowler | 279 | -1 | |||||
| 14 | Chris | Straka | 281 | +1 | 1 | 13 | 14 | 1 |
| Jose | Finau | 282 | +2 | |||||
| Chris | Clark | 284 | +4 | |||||
| Jeff | McCarthy | 284 | +4 | |||||
Tiebreakers are 1. eagles then 2. birdies then 3. double or triple bogeys and then 4. bogeys. Going into Sunday, tiebreakers are in play in three matchups:
- Thurm (Rory) and Jose (Fleetwood) both finished -14 and tied for second. Thurm breaks the tie with one eagle to Jose’s none.
- Greg (Homa) and Doug (Henley) both finished -11 and tied for fourth. Greg breaks the tie with one eagle to Doug’s none.
- Tom (Hovland) and Bill (Morikawa) both finished -10 and tied for sixth. Both had eagles, but Tom breaks the tie with 22 birdies to Bill’s 15.
- Juice (Si Woo Kim) and Haydn (Kirk) both finished -9 and tied for eighth. Juice breaks the tie with 15 birdies to Haydn’s 14.
- Kurt (Xander) and Andy (Tom Kim) both finished -7 and tied for tenth. Kurt breaks the tie with one eagle to Andy’s none.
Your niblick’s no good here, Flight

Paired with Jon Rahm, the top-ranked golfer heading into the tournament, Jim nonetheless finds himself buried deep in the bunker of double-digit draft positioning. Jim, or Jon, currently sits 12th heading into Sunday. Max, on the other hand, has parlayed the 25th-ranked golfer (Taylor Moore) into the top draft spot. But can he hold off Jose’s Tommy Fleetwood, just one stroke back? Or Greg’s Max Homa, two behind? Stay tuned…
| Pos. | Ganger | Golfer | Score | Under | Eagle | Birdie | Bogey | 2x Bogey |
| 1 | Max | Moore | 197 | -13 | 1 | 15 | 4 | |
| 2 | Jose | Fleetwood | 198 | -12 | 18 | 6 | ||
| 3 | Greg | Homa | 199 | -11 | 15 | 4 | ||
| 4 | Tom | Hovland | 201 | -9 | 1 | 18 | 7 | 2 |
| 5 | Thurm | Rory | 201 | -9 | 1 | 15 | 8 | |
| Thurm | Grillo | 201 | -9 | 16 | 7 | |||
| Max | Cantlay | 201 | -9 | 14 | 5 | |||
| 6 | Andy | Tom Kim | 201 | -9 | 11 | 2 | ||
| 7 | Bill | Morikawa | 202 | -8 | 1 | 12 | 6 | |
| 8 | Doug | Henley | 202 | -8 | 13 | 5 | ||
| Greg | Schenk | 203 | -7 | 13 | 6 | |||
| 9 | Juice | Si Woo Kim | 203 | -7 | 12 | 3 | 1 | |
| 10 | Kurt | Xander | 204 | -6 | 1 | 13 | 5 | 2 |
| Tom | Kitayama | 204 | -6 | 14 | 4 | 2 | ||
| 11 | Haydn | Scheffler | 204 | -6 | 13 | 5 | 1 | |
| Bill | Bradley | 205 | -5 | 13 | 8 | |||
| Haydn | Kirk | 205 | -5 | 10 | 5 | |||
| Kurt | Harman | 206 | -4 | 11 | 4 | 3x | ||
| 12 | Jim | Rahm | 207 | -3 | 14 | 7 | 2 | |
| Juice | Taylor | 207 | -3 | 13 | 10 | |||
| Jim | Hatton | 208 | -2 | 11 | 4 | 1 + 3x | ||
| Jose | Finau | 209 | -1 | 11 | 10 | |||
| Andy | Burns | 210 | E | 1 | 9 | 7 | 2 | |
| 13 | Jeff | McCarthy | 210 | E | 9 | 3 | 3 | |
| Doug | Fowler | 211 | +1 | 12 | 7 | 3 | ||
| Jeff | Day | 212 | +2 | 6 | 8 | |||
| 14 | Chris | Straka | 216 | +6 | 1 | 7 | 13 | 1 |
| Chris | Clark | 216 | +6 | 11 | 13 | 1 |
Tiebreakers are 1. eagles then 2. birdies then 3. double or triple bogeys and then 4. bogeys. Going into Sunday, tiebreakers are in play in three matchups:
- Tom (Hovland), Thurm (Rory) and Andy (Tom Kim) are all -9. Hovland and Rory both have an eagle, Kim does not. Hovland has 18 birdies to Rory’s 15, so Hovland wins the tiebreaker. Tom is #4, Thurm is #5, and Andy is #6.
- Bill (Morikawa) and Doug (Henley) are both -8. Henley has 13 birdies to Morikawa’s 12, but Morikawa has an eagle. So Morikawa wins that tiebreaker and Bill is #7 to Doug’s #8
- Kurt (Xander Schauffele) and Haydn (Scheffler) are both -6. Both have 13 birdies but Xander has an eagle. So Zander wins the tiebreaker and Kurt is #10 and Haydn is #11.
